Share:

.svg)
.svg)

Time sure flies and here we are — once again ready to analyze API Transformer over the course of one more year. We did a similar analysis back in 2017 as well. If you are interested, do check it out here.
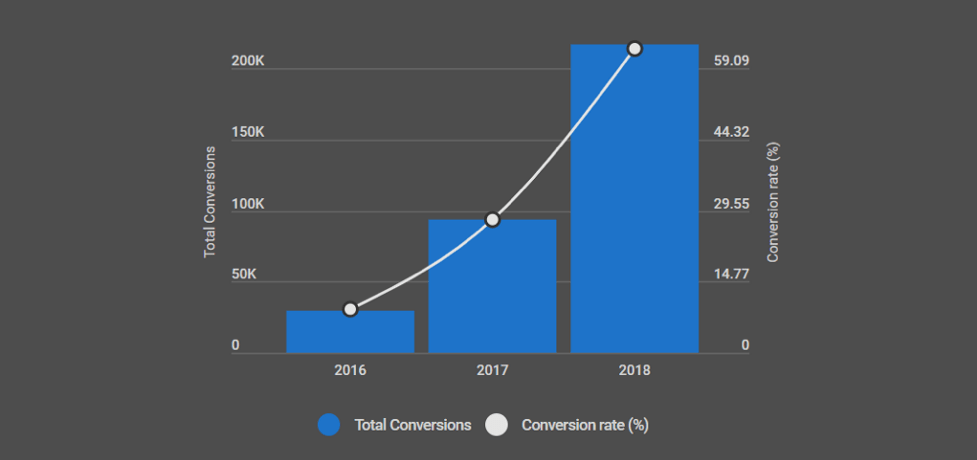
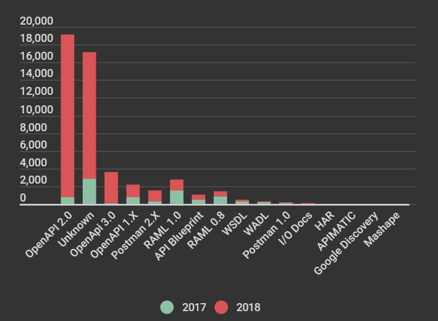
Interestingly, API Transformer’s usage appears to be doubling every year as can be seen from the figure above. 2018 has seen an all-time high — 217,388 transformations in total.
So why are so many people using API Transformer? What in fact is API Transformer?
Today, with an ever increasing number of APIs, more and more developers are recognizing the need to have machine-readable descriptions alongside these APIs. Some of these descriptions are maintained and exposed by the API providers themselves while others are created and maintained by third-party contributors. Format preferences tends to vary due to which a major issue with these descriptions is their heterogeneity. Given that each format has limitations of its own and a different set of tools and frameworks associated with it, anybody looking to utilize a description to its maximum capacity will feel the need to transform between available formats based on their requirements. This is where API Transformer comes in. It breaks all format barriers by enabling users to convert an API description easily into any format of their choice. It supports all popular formats e.g. OpenAPI (previously known as Swagger), RAML, API Blueprint, WSDL etc. which is what makes it an ideal tool for many.
What was new in 2018?
As promised at the end of 2017, we finally introduced support for Insomnia in December, 2018.
In addition to this, many improvements were added to API Transformer with focus on three key aspects: stability, consistency and accuracy.
Total vs Unique
For each aspect of API Transformer that we analyze below, calculations are performed over two kinds of data which are:
Total - This data takes into account all events that occurred irrespective of the users performing these events.
Unique - This data only considers unique events per user. This helps eliminate the skewness that arises in the previous case because of users who performed thousands of conversions every month.
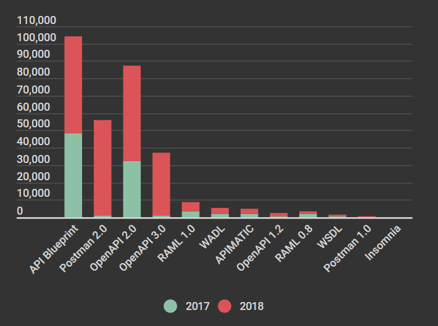
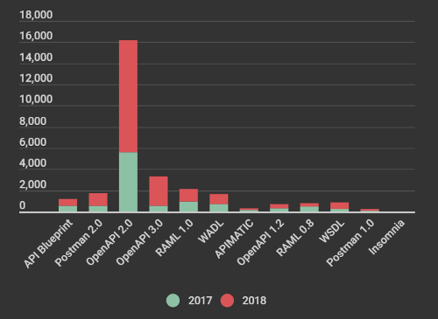
Which formats developers brought most as input?
Total
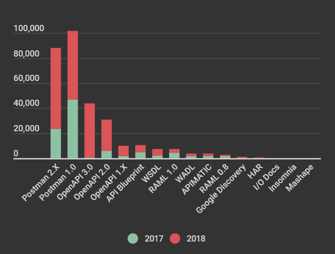
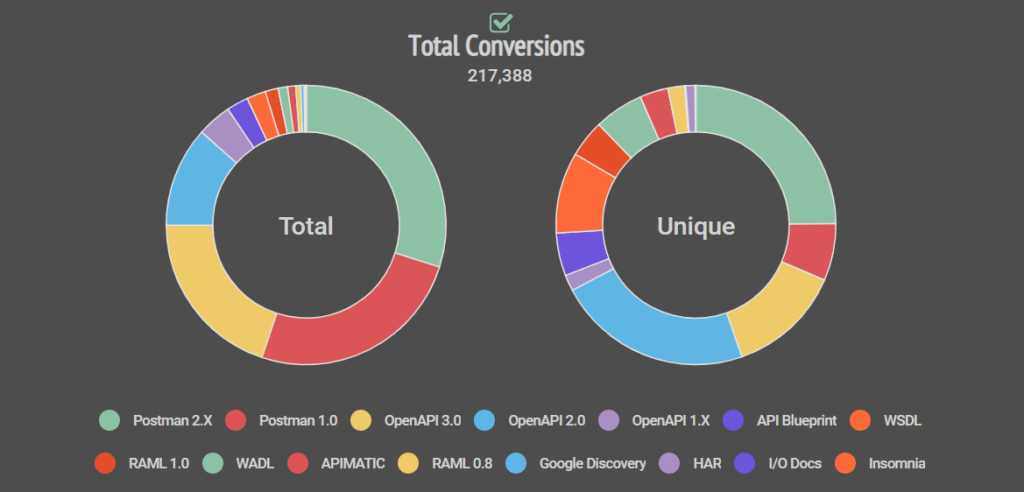
Out of the total imported files on Transformer (approximately 217,388), 55% were Postman files (versions 1.0, 2.0 and 2.1) while 35% were OpenAPI files (versions 1.x, 2.0 and 3.0). The rest fell under much smaller chunks. Unlike 2017, it can be seen that OpenAPI v.3.0 usage finally rose above v.2.0: 56% of the OpenAPI transformations belonged to v.3.0, 33% to v.2.0 and 11% to v.1.x.
Unique
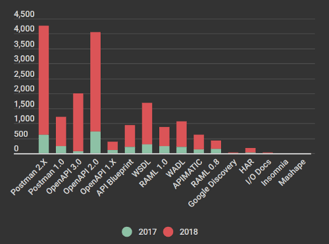
The second graph considers only unique formats per user e.g. if a user converted 50 Postman and 10 OpenAPI files, he converted two unique format files (one Postman and one OpenAPI).
The unique data shows that 38% of the imported files were OpenAPI files (all versions included) while 31% of the imported files were Postman files (all versions included). Around 9% of the users brought in WSDL files.
Overall
As can be seen from above, much like 2017, the two formats that stood out as the most imported formats on API Transformer in 2018 were still OpenAPI and Postman.
Which formats developers most converted to?
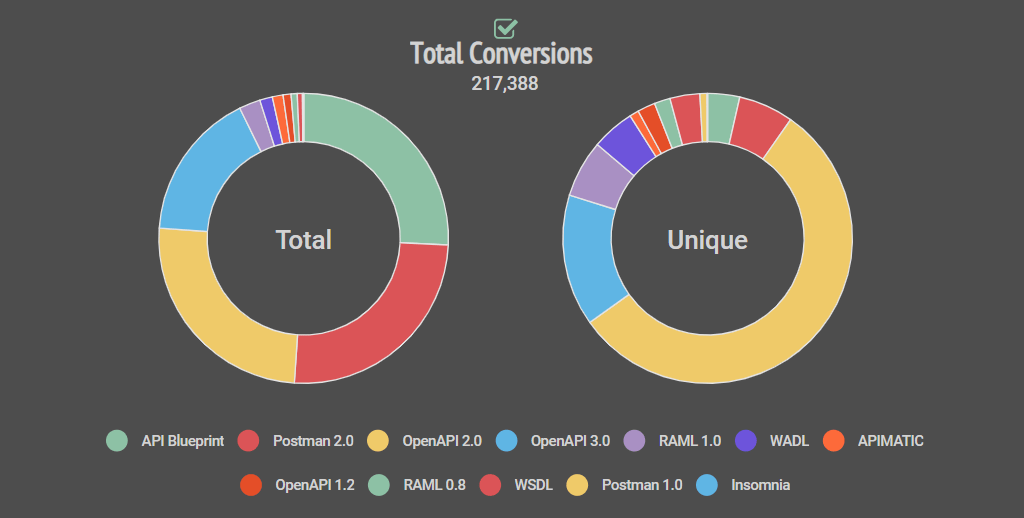
Total
43% of the conversions were to OpenAPI (versions 1.2, 2.0, 3.0). API Blueprint and Postman (versions 1.0, 2.0) were the next two major exported formats. They both appeared to be in a neck to neck race each sharing 25% of the complete chunk.
Unique
Eliminating multiple exports to the same format per user, we observed that 72% of the files were exported to OpenAPI (versions 1.2, 2.0, 3.0). 77% of this OpenAPI chunk consisted of v.2.0 files. This shows that although v.3.0 was a popular input format, much of the developers used API Transformer to export v.2.0 files instead of v.3.0.
Apart from OpenAPI, 8% files were exported to RAML (versions 0.8, 1.0) and 7% to Postman (versions 1.0, 2.0).
Overall
Like 2017, OpenAPI v.2.0 was again found to be the most popular exported format in 2018. This comes as no surprise since it is the most stable version of OpenAPI, being used for many years now. It boasts strong community support and a wide range of tools and frameworks. The adoption rate for its latest version v.3.0 is still relatively slower. However, it can be expected to rise with the passing time as more and more tools start supporting it.
Postman v.2.0 was another major exported format which is largely popular with users aiming to test or document their APIs. Very few users prefer to export to WADL or WSDL because of limited usage and tooling.
What were the top 10 conversions?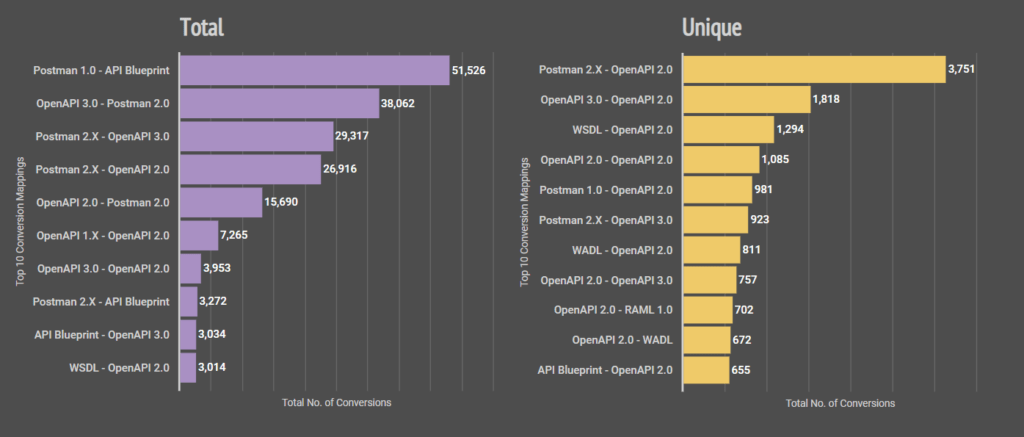
Here we analyze the import-export relationship in conversions and identify the top ten pairs for each kind of data.
Total
For the total conversions performed, the most common conversion seen was from Postman v.1.0 to API Blueprint (approx 51,526 conversions).
Unique
By eliminating non-unique mappings per user, import from Postman 2.X to OpenAPI 2.0 was found to be the most common (approx 3,751 conversions).
Overall
Based on above data it can be seen that, much like 2017, developers still preferred Transformer for converting from Postman to other API description formats.
Where were the developers performing conversions geographically based?
In this section, we aim to analyze the geographical usage of API Transformer.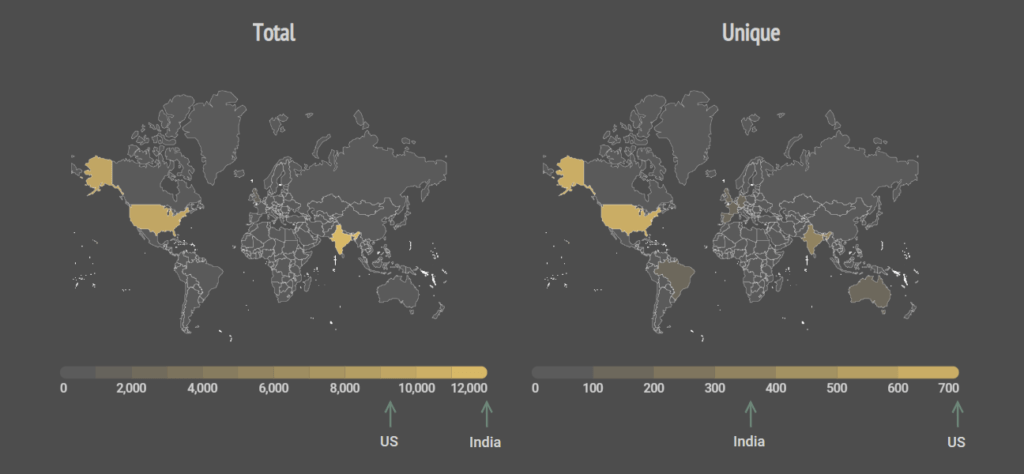
Total
A large number of conversions were performed from India (36%), US (28%) and UK (5%) while the rest of the conversions were distributed across other parts of the world.
Unique
Ignoring multiple conversions from the same location per user, the results we got showed that 22% of the conversions were performed from US, 11% from India while 6% were from UK.
Overall
As can be clearly seen, majority of our users using Transformer in 2018 were based in US, India and UK. Note that for these graphs we eliminated data of conversions in which the locations were unknown.
Which formats failed to transform most (and why)?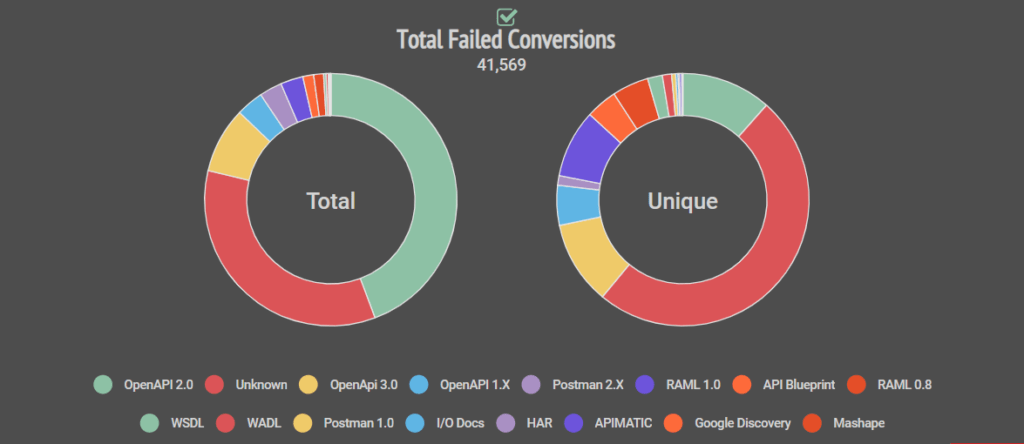
With the increasing number of transformations, a rise in the number of failed transformations was also seen (approx. 41,569 which is roughly 19% of the total conversions performed).
Total
56% of the total failed transformations involved OpenAPI files (versions 1.x, 2.0, 3.0) as input while 34% of the failures occurred when users tried converting invalid/unsupported files.
Unique
After removing redundant format failures per user, 49% of the total failed transformations were found to be from invalid/unsupported files while only 27% were due to OpenAPI files (versions 1.x, 2.0, 3.0). 13% were attributed to RAML files (versions 0.8, 1.0).
Overall
As you can see, a large portion of failures constituted of the invalid/unsupported files. Following are the kinds of files that fall under this category:
- Not valid API description files e.g. HTML files, JSON response data, XML schema files, etc.
- Files that lacked necessary metadata, thus, preventing identification at the time of conversion e.g. API Blueprint files without “Format” and “Host” information.
- Format files that contained some critical errors/ human mistakes preventing them from being identified properly e.g. invalid JSON, incomplete file, etc.
The rest of the failed conversions mainly consisted of RAML or OpenAPI files. These transformations failed largely due to errors/human mistakes while a small portion of them failed due to bugs in our tool which were later fixed.
In 2018, we analyzed, in the form of a blog series, the common mistakes developers made resulting in failed transformations. If you are interested to learn more, please head over to the following:
Common Mistakes Developers Make in Their API Blueprint Files
Did developers prefer to transform via the website or via our API?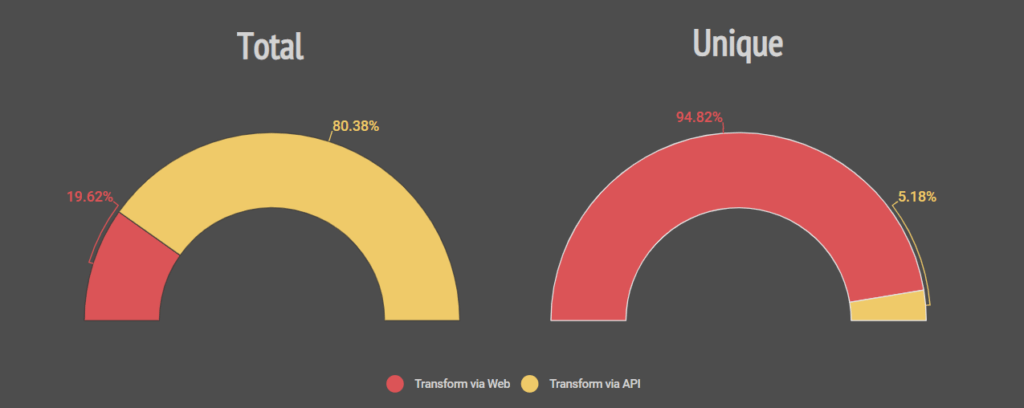
API Transformer not only provides a web UI to users for performing conversions but also facilitates them by providing a simple Transformation API that offers the same functionality as the UI.
Total
In 2018, 80% of the total conversions were performed by users over the API while only 20% were performed via the web UI. The data here is skewed largely due to several of our users performing thousands of conversions via the API every month. This skewness is ignored in the second data discussed below.
Unique
In contrast to what the results from the Total data shows, if we consider unique conversions per user, 95% of the conversions were performed via web while only 5% were performed via the API.
Overall
Ignoring the skewness, it can be safely concluded that majority of the conversions were performed using the web UI.
What trends could be seen in terms of size of APIs?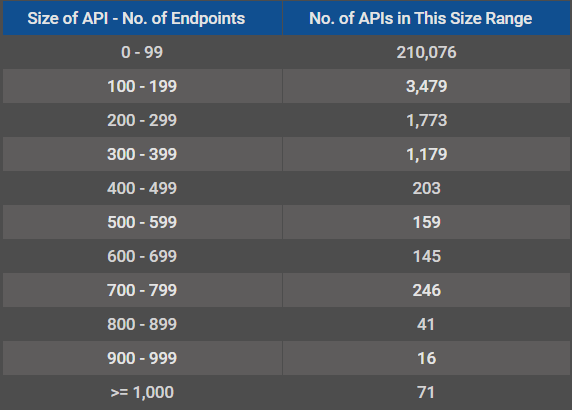
For measuring the size of an API, we considered the number of endpoints in an API. 97% of the APIs involved in the conversions had less than 100 endpoints while 3% of the APIs had endpoints ranging between 100 and 500. The remaining small portion of APIs had endpoints greater than 500. It can be concluded that, with a few exceptions, APIs with less than 100 endpoints are the most common.
Conclusion
2018 undoubtedly turned out be quite an important year for API Transformer both in terms of its growth and stability. We hope to make API Transformer even better and stronger in the days to come. You can also play a big role in that! If you have any feedback or ideas that you want to share with us or have any queries, please don’t hesitate to reach out to support@apimatic.io.